I’ve spent enough late nights inside Excel to know the usual pain points by heart. A formula breaks in one cell. A forecast shifts for no clear reason. A manager wants a clean explanation in five minutes, and the workbook still looks like a construction site.
That is the lens I brought to Microsoft Copilot in Excel. I did not test it as a shiny demo. I tested it like a finance user would. I wanted to see whether it could help with real modeling work such as writing formulas, spotting odd movement in a dataset, building quick visuals, and helping me explain what changed. Microsoft’s current documentation says Copilot in Excel can suggest formulas, summarize data, add visuals, and support deeper analysis, including Python-based workflows in Excel.
My early takeaway was simple. Copilot is not your finance brain. It is more like a fast, sometimes surprisingly useful assistant sitting next to your spreadsheet. When the data is structured well and the request is specific, it can save real time. When the prompt is vague or the model logic is messy, it can drift. That gap matters a lot in financial modeling, where one bad assumption can ripple through everything.

What Microsoft Copilot in Excel Actually Does for Financial Modeling
It helps with formulas without forcing you to remember every bit of syntax
One of the most practical uses is formula help. Microsoft says Copilot in Excel can suggest formulas and work from natural-language requests. In plain terms, that means you can ask for things like month-over-month growth, gross margin, or variance formulas instead of building each one from scratch. That does not remove the need to review the formula, but it does cut down the blank-page feeling that comes with building a model from zero.
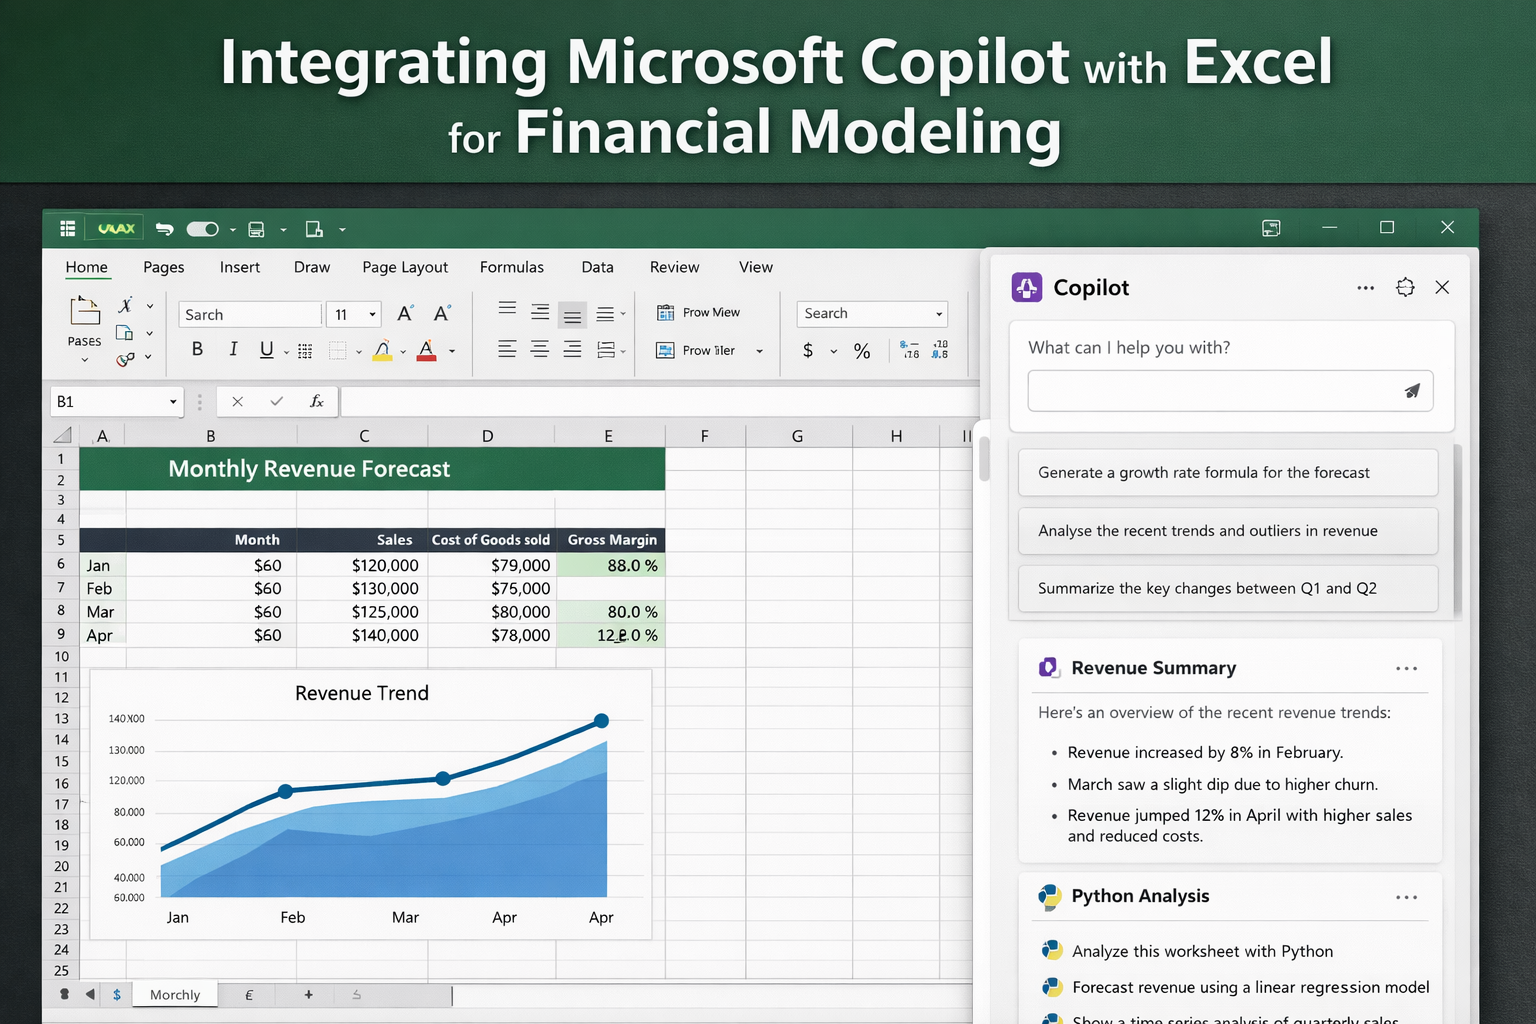
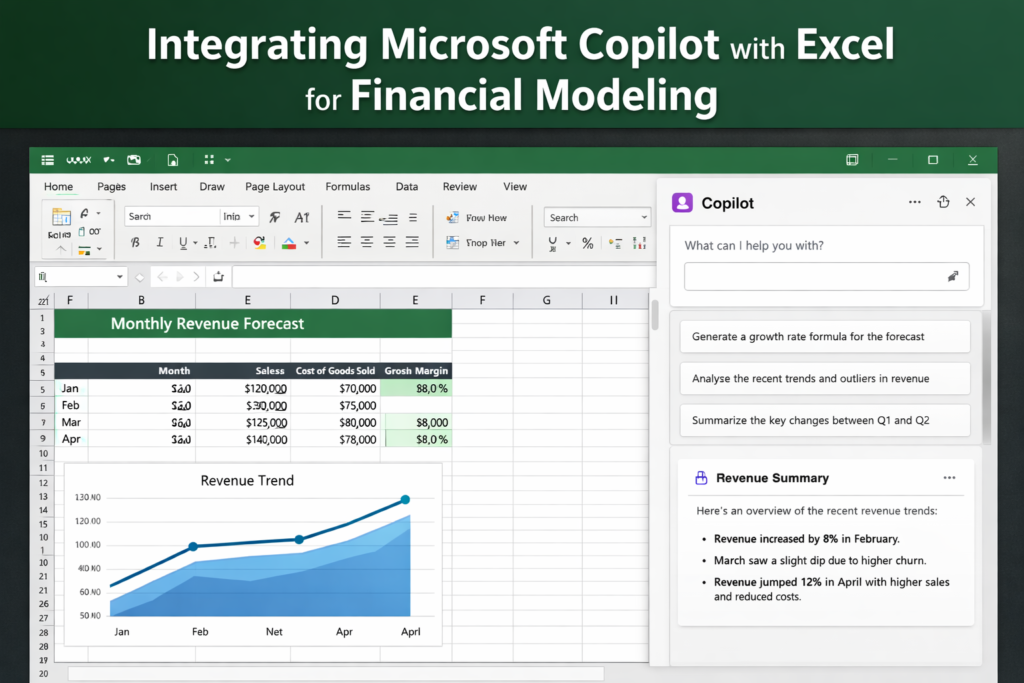
In my own test, this was where Copilot felt most grounded. I gave it a monthly revenue sheet and asked for a clean way to calculate growth rates and margin percentages across a structured table. It gave me a usable starting point fast. Not perfect. Usable. That difference matters. If you already know what the logic should be, Copilot can move you past repetitive setup work.
It can summarize data and surface patterns quickly
Financial modeling is not just about formulas. It is also about reading the story inside the numbers. Microsoft says Copilot can summarize data, identify patterns in numerical datasets, and return results with visuals like charts and PivotTables. For finance teams, that matters because a lot of work happens after the model is built. You still have to explain the spike in expenses, the drop in revenue, or the weird movement in customer churn.
I found this useful when I wanted a first-pass read on what changed between periods. Instead of manually scanning every line item, I asked Copilot to point out unusual shifts and summarize the biggest changes between one quarter and the next. It was not ready for the board deck as-is, but it was good enough to speed up my own review and help me decide where to look next.
It supports editing and workbook tasks that are tied to finance work
Microsoft also positions Copilot as a tool for editing workbooks in natural language. That includes actions like adjusting ranges, working with sheets, formatting data, and carrying out multi-step workbook actions. For someone working in financial models every week, that can remove a lot of low-value friction. Clean this. Rename that. Add a helper column. Change the format. Create a table. Those small actions add up.
This is where I think many users will get the quickest win. Not from some dramatic one-click model generator, but from shaving time off the little tasks that pile up around a live workbook.
It can go deeper with Python in Excel
This part is easy to miss, but it is one of the more interesting angles for finance users. Microsoft has said Copilot in Excel can support advanced analysis with Python in Excel, which opens the door to more serious data work when a normal worksheet starts to feel cramped. That can be useful for trend analysis, more involved forecasting work, or larger datasets where simple formulas stop being comfortable.
I would not throw every finance problem into Python just because it is there. But for analysts who already hit the ceiling of standard worksheet analysis, this gives Copilot more room to be helpful.
Why Financial Analysts and FP&A Teams Care About This
If you work in finance, the real issue is rarely “Can Excel do it?” Excel can usually do it. The issue is how long it takes, how easy it is to make a mistake, and how painful it is to explain the output to someone else.
That is where Copilot starts to make sense.
A lot of financial modeling work is repetitive in a very specific way. You build a forecast. Then you check the formulas. Then you clean the layout. Then you write commentary on the numbers. Then someone asks for a different cut of the same data. Microsoft’s official materials focus on the same pattern. Copilot in Excel is built to help users generate formulas, summarize data, add visuals, and answer questions in natural language when the data is in a supported table or range.
For FP&A teams, that means a few things stand out right away:
- Faster first drafts of recurring formulas
- Quicker detection of outliers or period-over-period swings
- Easier creation of review charts and summaries
- Less time spent translating numbers into plain English
That does not mean it replaces analyst judgment. It does not. I would not trust any AI assistant to own assumptions, validate business logic, or sign off on a model that leadership is about to use for a major decision. Finance work still depends on clean source data, sound structure, and human review.
But I do think it helps with a pain point almost every analyst knows well. Sometimes the hardest part of the job is not the math. It is the drag. The repetitive, mechanical drag of building, formatting, checking, and explaining. Copilot has a real shot at cutting that drag down when you use it with care.
In my testing, that was the most honest way to frame it. Not a magic layer over Excel. Not a replacement for a finance pro. Just a tool that can make the spreadsheet feel a little less heavy.